Tất tần tật những điều cần biết về IELTS Writing Academic Task 1
Trong phần thi IELTS Writing, thí sinh sẽ phải viết hai task trong thời gian 60 phút. Task 1 yêu cầu thí sinh nhận xét về bảng biểu, biểu đồ cho sẵn. Task 2 yêu cầu thí sinh đưa ra ý kiến, quan điểm của mình về một vấn đề nào đó. Trong bài viết dưới đây, Patado sẽ hướng dẫn bạn cách làm dạng bài IELTS Academic Writing task 1. Vậy Writing task 1 có những dạng bài nào? Tiêu chí chấm điểm ra sao? Cùng tìm hiểu qua bài viết dưới đây nhé!
Xem thêm:
IELTS là gì? Tất tần tật những điều cần biết về IELTS
Định hướng cách làm IELTS Academic Writing Task 2
I/ Tổng quan về IELTS Academic Writing task 1
IELTS Academic Writing task 1 là một trong hai phần của bài thi IELTS Writing, chiếm ⅓ số điểm của phần thi Writing. Ở phần này, đề bài sẽ cho số liệu của bảng biểu, hình ảnh của một quy trình, số liệu biểu đồ,… Thí sinh sẽ dựa vào các số liệu, hình ảnh này để viết nhận xét hoặc mô tả trong khoảng 150 chữ.
IELTS Academic Writing task 1 yêu cầu thí sinh có khả năng sử dụng ngôn từ thường gặp trong các bài báo cáo, nhận xét hoặc tổng quan về một vấn đề nào đó. Bạn không cần đưa ý kiến cá nhân (chủ quan) vào bài viết mà chỉ cần dựa trên hình ảnh, số liệu đã cho để đưa ra ý kiến khách quan, ngắn gọn.
IELTS Writing task 1 yêu cầu thí sinh nhận xét, mô tả về hình ảnh, dữ liệu cho sẵn
II/ Một số dạng bài thường gặp trong Academic IELTS Writing task 1
Thông thường, trong bài thi Academic IELTS Writing Task 1, thí sinh sẽ gặp một trong 7 dạng bài sau:
1. IELTS Writing – Dạng Table:
Ví dụ về dạng bài Table – Academic IELTS Writing task 1
>>> Xem thêm: IELTS Writing – Cách làm IELTS Writing task 1- Table
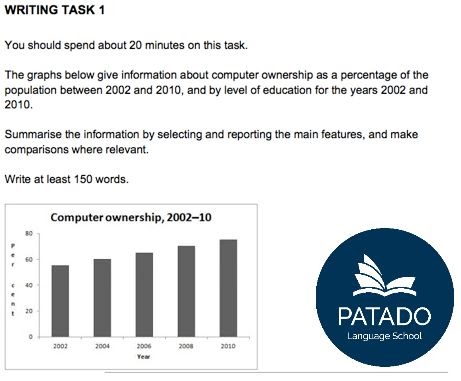
2. IELTS Writing – Dạng Bar Chart
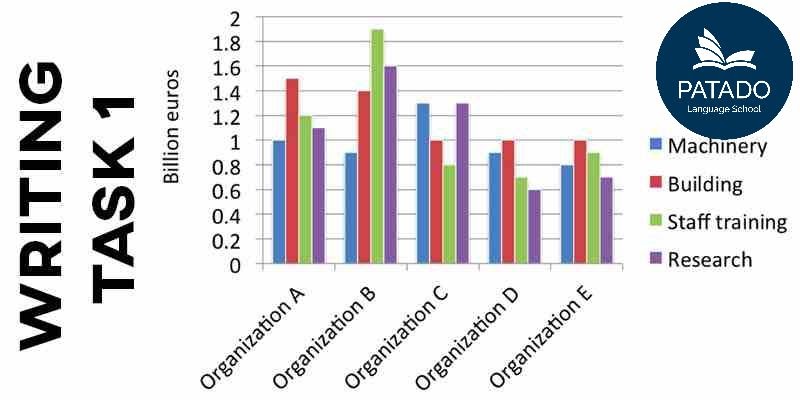
Ví dụ về dạng bài Bar chart – IELTS Writing task 1
>>> Xem thêm: IELTS Writing – Cách làm IELTS Writing task 1- Bar chart
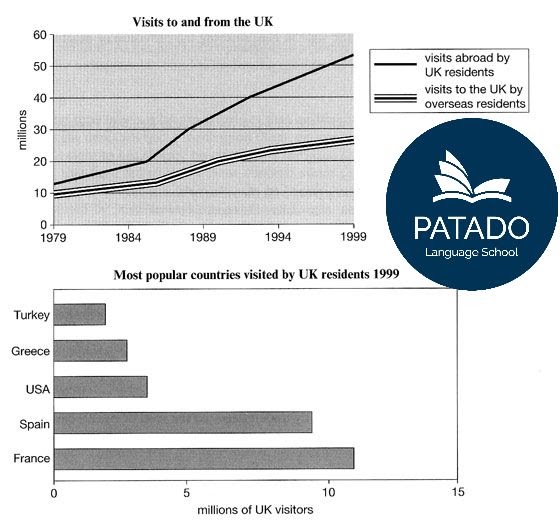
3. IELTS Writing – Dạng Line graph:
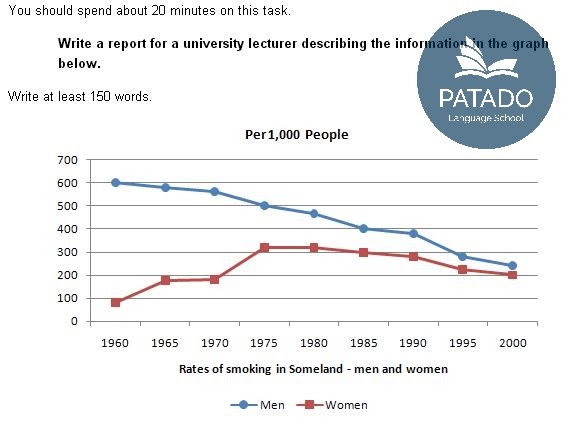
Ví dụ về dạng bài Line graph
>>> Xem thêm: IELTS Writing – Cách làm IELTS Writing task 1- Line
4. Pie chart:
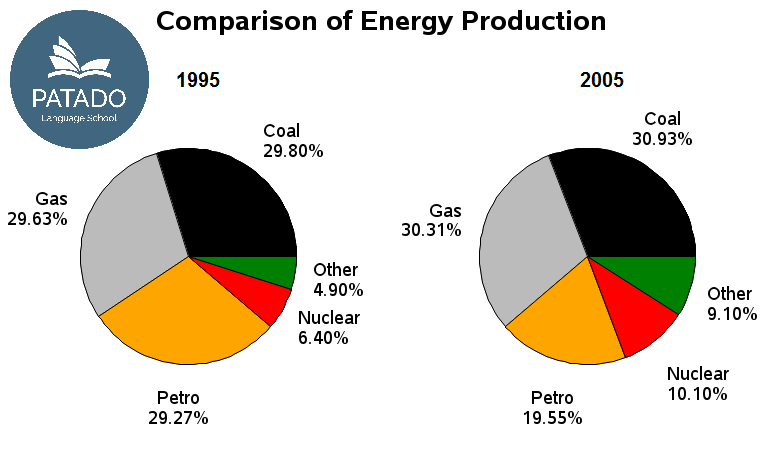
Ví dụ về dạng bài Pie chart IELTS Writing
>>> Xem thêm: IELTS Writing – Cách làm dạng IELTS Writing task 1- Pie chart
5. Process:
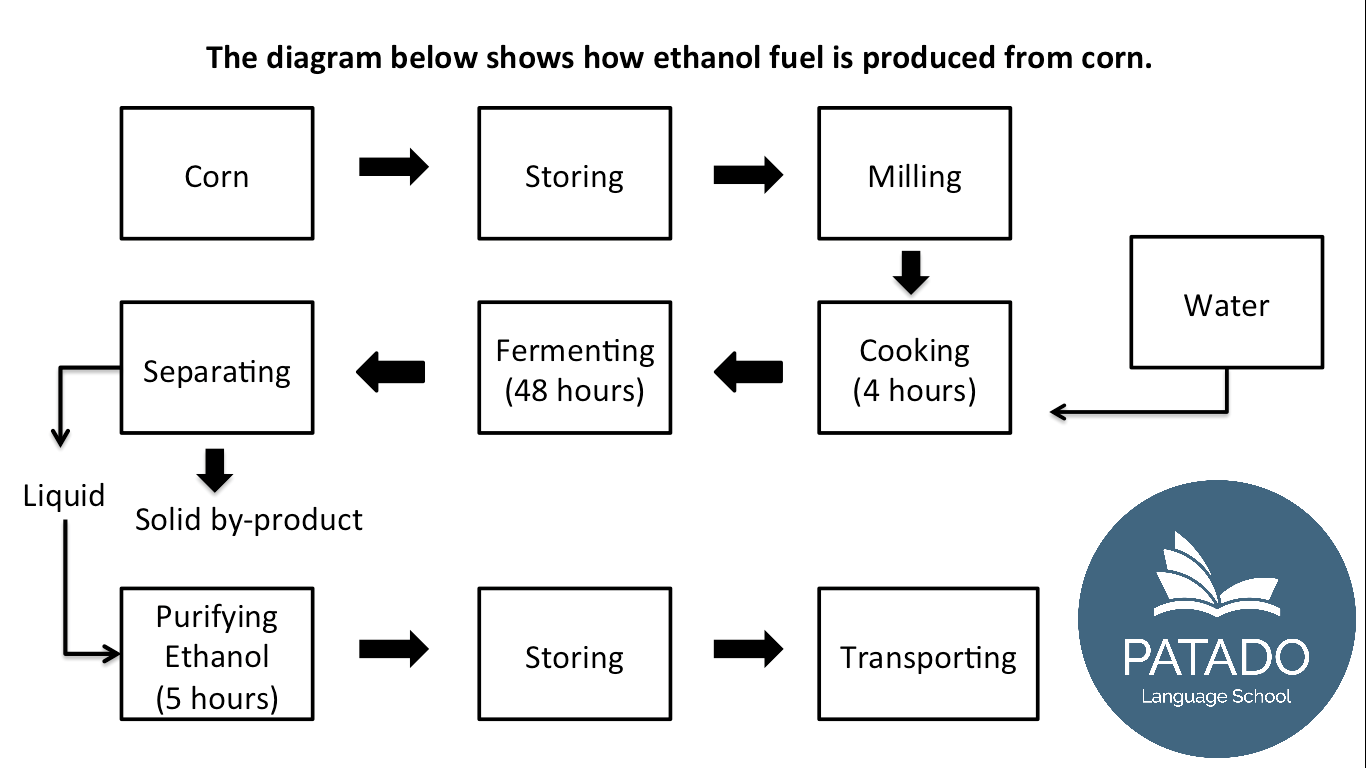
Ví dụ về dạng bài Process – IELTS Writing task 1
>>> Xem thêm: IELTS Writing – Cách làm dạng IELTS Writing task 1 Process
6. Map:
Ví dụ về dạng bài Map – IELTS Writing
>>> Xem thêm: Ielts writing – Cách làm ielts writing task 1- Map
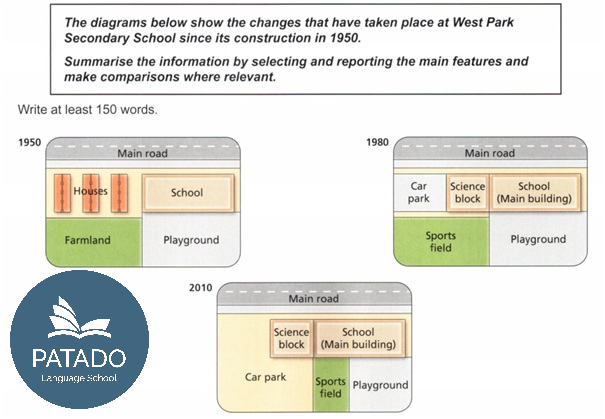
7. Mixed
Ví dụ về dạng bài Mix – IELTS Writing
>>> Xem thêm: IELTS Writing – Cách làm IELTS Writing task 1- Mixed
III/ Tiêu chí chấm điểm Academic IELTS Writing task 1
Phần thi Academic IELTS Writing task 1 sẽ chiếm ⅓ số điểm của cả bài thi Writing. Giám khảo sẽ đánh giá bài làm của thí sinh qua 4 tiêu chí sau:
- Task Response: Ở tiêu chí này, giám khảo sẽ đánh giá khả năng định hướng và trả lời đúng yêu cầu của đề. Bạn cần nêu đúng nhận xét, mô tả tương ứng với từng dạng bài trong Writing Task 1: Table, Bar chart, Line graph, Pie chart, Process, Map và Mix.
- Coherence & Cohesion: Bài làm của bạn phải có sự kết dính nhất định giữa các câu, các đoạn với nhau. Để đạt được điểm cao trong tiêu chí này, bạn cần linh hoạt sử dụng các từ nối và biết cách sắp xếp các ý sao cho logic, liền mạch.
- Lexical Resource: Đây là tiêu chí đánh giá về từ vựng. Trong IELTS Writing Task 1, bạn cần biết sử dụng linh hoạt ngôn từ thường gặp trong các bài báo cáo, diễn tả sự thay đổi của số liệu và mô tả chính xác, ngắn gọn một quy trình, bản đồ nào đó. Ngoài ra, trong phần này, giám khảo cũng kiểm tra lỗi sai chính tả của từng từ.
- Grammatical Range and Accuracy: Đây là tiêu chí đánh giá khả năng sử dụng ngữ pháp của thí sinh. Thông thường, IELTS Writing task 1 không đòi hỏi thí sinh phải sử dụng những cấu trúc quá nâng cao. Bạn chỉ cần sử dụng một số cấu trúc đơn giản, ngắn gọn, đảm bảo truyền đạt đủ thông tin là có thể nắm chắc điểm cao phần này.
>>> Xem thêm: Lộ trình phương pháp và cách học IELTS Writing
IV/ Một số lưu ý khi làm Academic IELTS Writing Task 1
1. Nên viết phần Overall
Sau khi viết xong mở bài, trước khi trình bày hay so sánh số liệu được đề cập tới trong bài, bạn nên viết phần Overall để giới thiệu tổng quan về nội dung bài viết. Tuy không bắt buộc nhưng nếu bạn muốn đạt điểm Writing IELTS từ 6.5 trở lên, đây là phần bạn nên cho thêm vào bài viết của mình. Lưu ý trong phần Overall, bạn chỉ trình bày nội dung bài viết, nội dung bảng biểu đã cho một cách chung chung, không nên đưa số liệu quá chi tiết vào phần này. Độ dài lý tưởng cho phần Overall trong IELTS Writing Academic là khoảng 1 – 2 câu.
2. Không cần viết kết bài
Một số bạn có thói quen viết phần kết bài (Conclusion) cho IELTS Academic Writing Task 1. Tuy nhiên, điều này thật sự không cần thiết. Kể cả bài của bạn có kết luận hay không thì giám khảo vẫn cho điểm bạn như bình thường. Vì vậy, để tránh mất thời gian, trong IELTS Writing Academic Task 1, bạn không cần phải viết kết bài.
3. Không nên dành quá nhiều thời gian cho IELTS Writing Academic Task 1
Do bài thi IELTS Writing chỉ kéo dài 60 phút nên thời gian nhiều nhất để bạn hoàn thành IELTS Writing Academic Task 1 là 20 phút. 40 phút còn lại bạn sẽ dành để viết IELTS Writing Task 2 và soát lại bài. Hơn nữa, do điểm IELTS Writing Task 1 chỉ chiếm ⅓ tổng số điểm cả bài nên việc dành quá nhiều thời gian trong phần này là điều không cần thiết. Hãy luôn nhìn đồng hồ và tính thời gian để tránh việc bị vội lúc cuối giờ nhé!
IV/ Tài liệu tham khảo Academic IELTS Writing task 1
1. Dạng bài Table
Bài mẫu tham khảo:
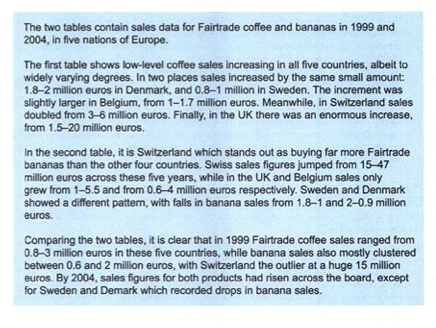
Nguồn: Test 2 – Writing Task 1 – Cambridge IELTS 10
2. Dạng bài Bar chart
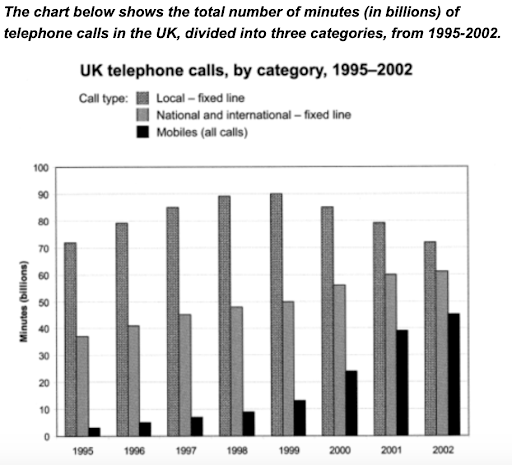
Bài mẫu tham khảo:
The bar chart compares the amount of time spent by people in the UK on three different types of phone call between 1995 and 2002.
It is clear that calls made via local, fixed lines were the most popular type, in terms of overall usage, throughout the period shown. The lowest figures on the chart are for mobile calls, but this category also saw the most dramatic increase in user minutes.
In 1995, people in the UK used fixed lines for a total of just over 70 billion minutes for local calls, and about half of that amount of time for national or international calls. By contrast, mobile phones were only used for around 4 billion minutes. Over the following four years, the figures for all three types of phone call increased steadily.
By 1999, the amount of time spent on local calls using landlines had reached a peak at 90 billion minutes. Subsequently, the figure for this category fell, but the rise in the other two types of phone call continued. In 2002, the number of minutes of national / international landline calls passed 60 billion, while the figure for mobiles rose to around 45 billion minutes.
(197 words, band 9)
3. Dạng bài Pie chart:
Bài mẫu tham khảo:
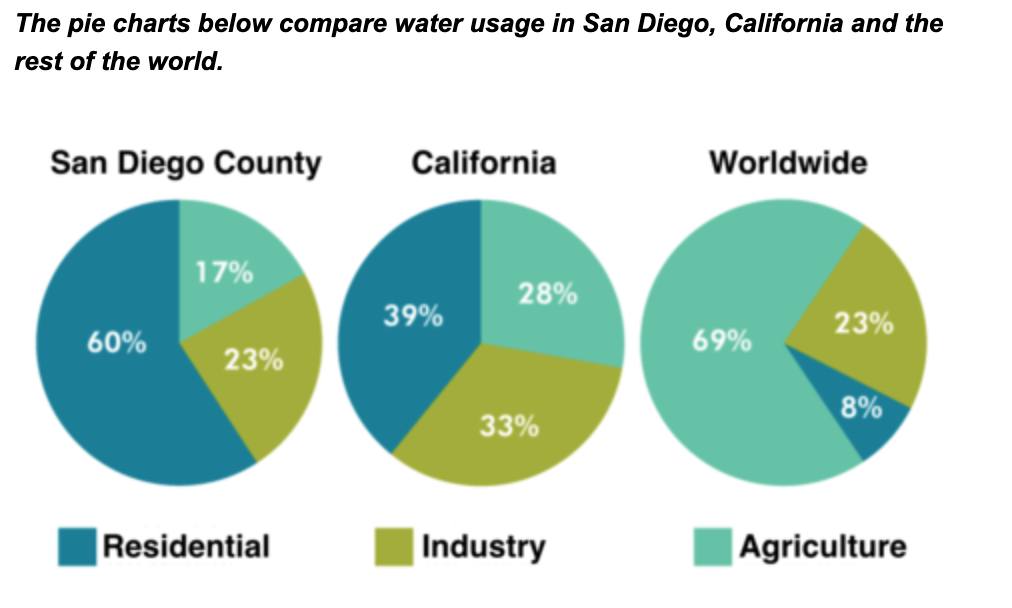
The pie charts give information about the water used for residential, industrial and agricultural purposes in San Diego County, California, and the world as a whole.
It is noticeable that more water is consumed by homes than by industry or agriculture in the two American regions. By contrast, agriculture accounts for the vast majority of water used worldwide.
In San Diego County and California State, residential water consumption accounts for 60% and 39% of total water usage. By contrast, a mere 8% of the water used globally goes to homes. The opposite trend can be seen when we look at water consumption for agriculture. This accounts for a massive 69% of global water use, but only 17% and 28% of water usage in San Diego and California respectively.
Such dramatic differences are not seen when we compare the figures for industrial water use. The same proportion of water (23%) is used by industry in San Diego and worldwide, while the figure for California is 10% higher, at 33%.
(168 words, band 9)
4. Dạng bài Line graph
Bài mẫu tham khảo:
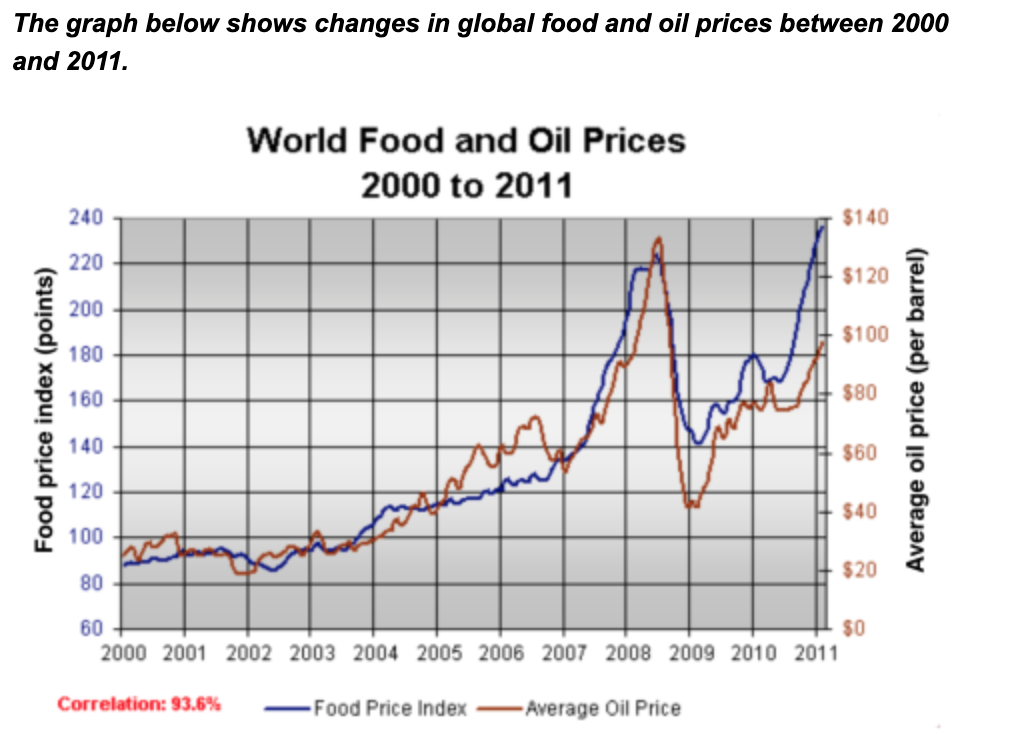
The line graph compares the average price of a barrel of oil with the food price index over a period of 11 years.
It is clear that average global prices of both oil and food rose considerably between 2000 and 2011. Furthermore, the trends for both commodities were very similar, and so a strong correlation (93.6%) is suggested.
In the year 2000, the average global oil price was close to $25 per barrel, and the food price index stood at just under 90 points. Over the following four years both prices remained relatively stable, before rising steadily between 2004 and 2007. By 2007, the average oil price had more than doubled, to nearly $60 per barrel, and food prices had risen by around 50 points.
A dramatic increase in both commodity prices was seen from 2007 to 2008, with oil prices reaching a peak of approximately $130 per barrel and the food price index rising to 220 points. However, by the beginning of 2009 the price of oil had dropped by roughly $90, and the food price index was down by about 80 points. Finally, in 2011, the average oil price rose once again, to nearly $100 per barrel, while the food price index reached its peak, at almost 240 points.
5. Dạng bài Map
Bài mẫu tham khảo:
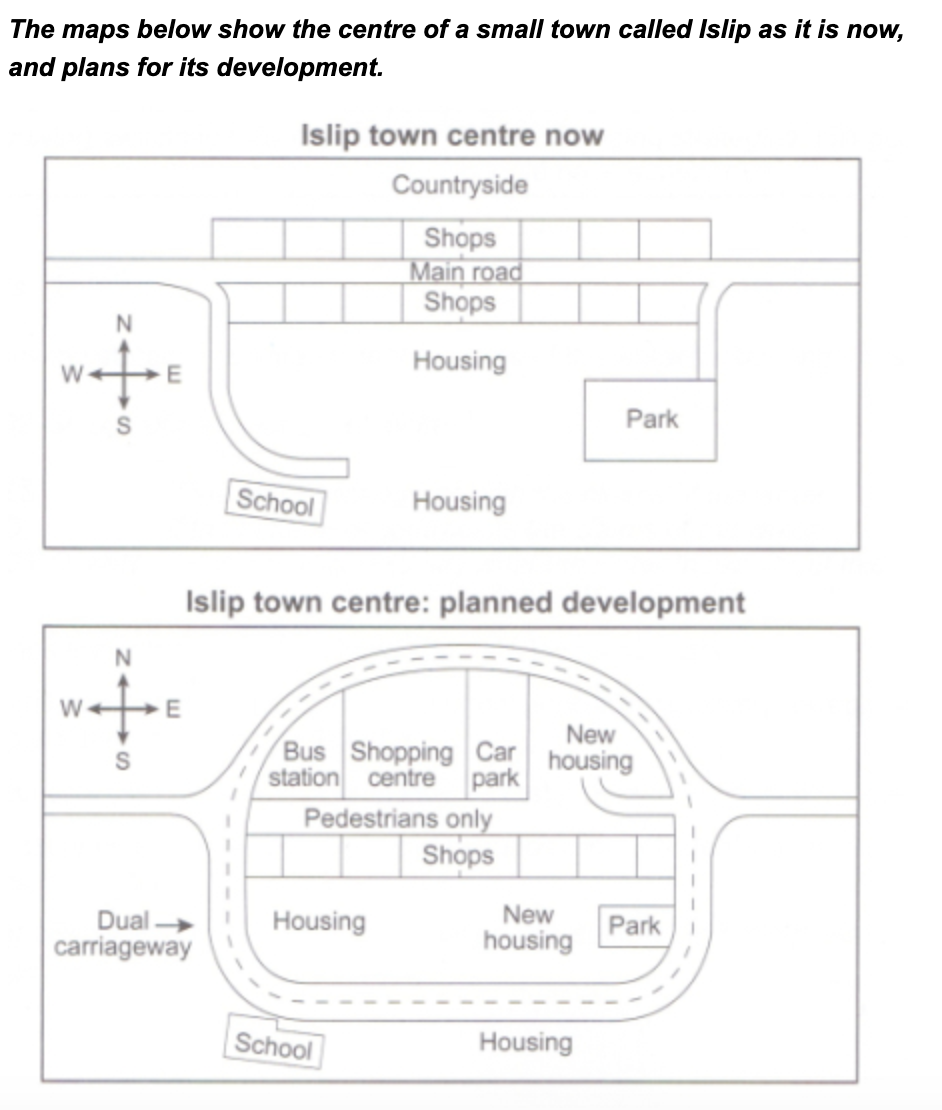
The diagrams illustrate some proposed changes to the central area of the town of Islip.
It is clear that the principal change to the town will be the construction of a ring road around the centre. Various other developments with regard to shops and housing will accompany the building of this road.
Looking at the map of Islip as it is now, we can see that a main road runs through its centre from east to west. The second map shows the planned pedestrianisation of this road. Traffic will be diverted on to a dual carriageway that will form a ring around the town centre.
Currently there is a row of shops along either side of the main road. However, it appears that the shops along the north side of the new pedestrian street will be demolished to make way for a bus station, shopping centre, car park and new housing area. The shops along the south side of the street will remain, but it seems that the town’s park will be reduced in size so that more new houses can be built within the ring road.
(187 words, band 9)
6. Dạng bài Process
Bài mẫu tham khảo:
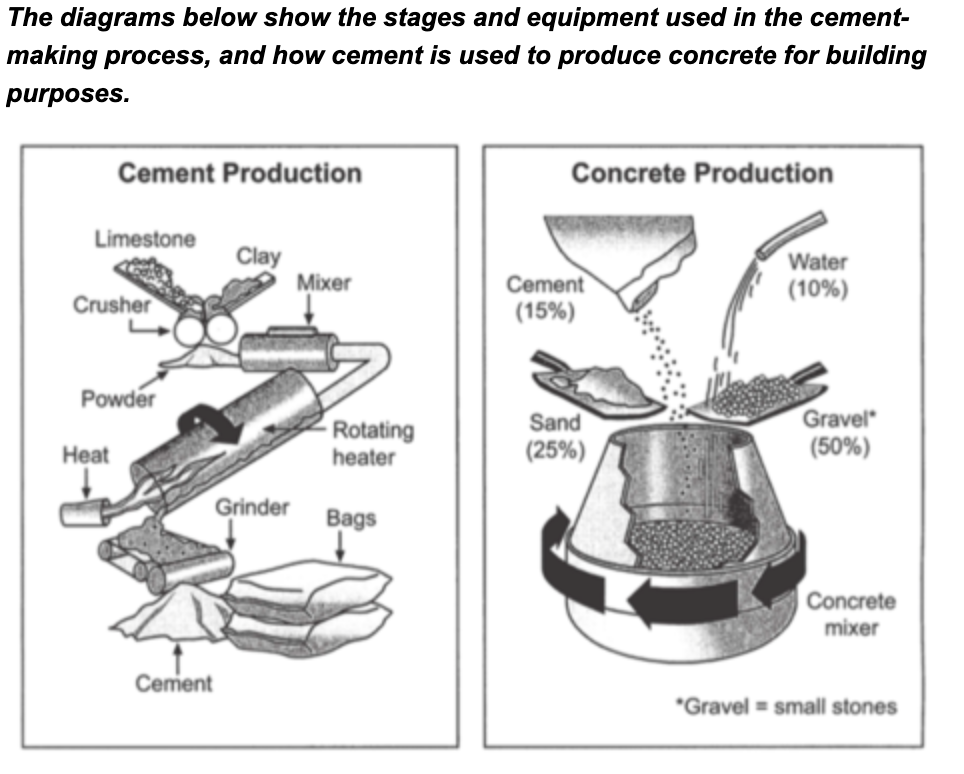
The first diagram illustrates the process of cement manufacture, and the second diagram shows the materials that go into the production of concrete.
It is clear that there are five stages in the production of cement, beginning with the input of raw materials and ending with bags of the finished product. To produce concrete, four different materials are mixed together.
At the first stage in the production of cement, limestone and clay are crushed to form a powder. This powder is then mixed before it passes into a rotating heater. After heating, the resulting mixture is ground, and cement is produced. Finally, the cement is packaged in large bags.
Cement is one of the four raw materials that are used in the production of concrete, along with gravel, sand and water. To be exact, concrete consists of 50% gravel, 25% sand, 15% cement and 10% water. All four materials are blended together in a rotating machine called a concrete mixer.
7. Dạng bài Mix
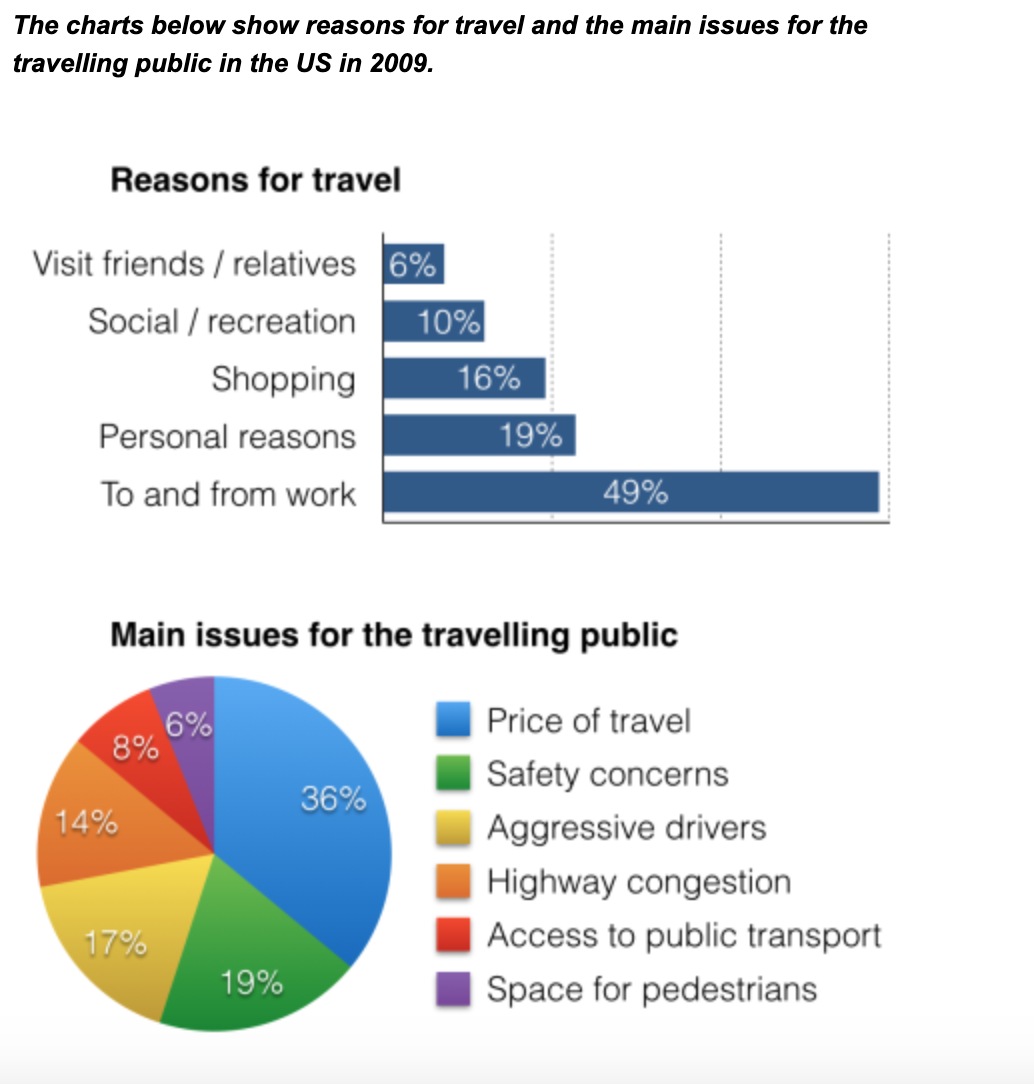
Bài mẫu tham khảo:
The bar chart and pie chart give information about why US residents travelled and what travel problems they experienced in the year 2009.
It is clear that the principal reason why Americans travelled in 2009 was to commute to and from work. In the same year, the primary concern of Americans, with regard to the trips they made, was the cost of travelling.
Looking more closely at the bar chart, we can see that 49% of the trips made by Americans in 2009 were for the purpose of commuting. By contrast, only 6% of trips were visits to friends or relatives, and one in ten trips were for social or recreation reasons. Shopping was cited as the reason for 16% of all travel, while unspecific ‘personal reasons’ accounted for the remaining 19%.
According to the pie chart, price was the key consideration for 36% of American travellers. Almost one in five people cited safety as their foremost travel concern, while aggressive driving and highway congestion were the main issues for 17% and 14% of the travelling public. Finally, a total of 14% of those surveyed thought that access to public transport or space for pedestrians were the most important travel issues.
(201 words, band 9)
Nguồn: IELTS Simon
Hy vọng qua bài viết vừa rồi, các bạn đã có thêm được những tài liệu quý báu về từng dạng bài trong Academic IELTS Writing Task 1. Nắm chắc cách làm và đọc những bài mẫu chất lượng, kết hợp với luyện tập thật nhiều chính là chìa khoá để thành công. Nếu có bất kỳ thắc mắc gì, hãy liên hệ tới Patado để được tư vấn và giải đáp miễn phí nhé!